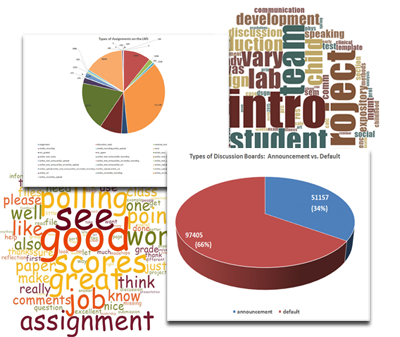
 Figure 1: A Collage of Data Visualizations from the LMS Data Portal Flat Files (click to view full version) Figure 1: A Collage of Data Visualizations from the LMS Data Portal Flat Files (click to view full version)
In this case, the Canvas LMS Data Portal for the Kansas State University enables access to a few dozen “flat files” or data tables. Originally downloaded from a SQL server, these data tables are not interconnected with each other in this form, and while there are columns for primary keys, these are not defined in this context. While there is personally identifiable information (PII) that dis-ambiguates the users, this data context does not offer easy or apparent ways to create granular-level insights. (In other words, it’s not possible from this data to ask questions like: In Course A, which students were in the top quintile, and which were in the bottom one, and what were the differences in behaviors between the top group and the bottom one?)
A Self-Emergent Macro Structure
What is available, though, is a profile of the university’s online learning instance because of a self-emergent superstructure that emerges from the millions of lines of data that capture individual decisions and uses of the system. These individual choices are informed by school policies, technology trainings, software tool documentation, and help desk support; these individual choices ultimately accumulate, and these accrued data form a high-level summary view of how the members of the university community collectively use their LMS. These data provide awareness and insight for leadership planning and decision-making and possibly for instructional design.
Instructional Design Interest
This begs the question of what instructional designers do and why these data may have relevance. An instructional designer basically evaluates teaching and learning context and designs (and develops or co-develops) learning objects, websites, wikis, online courses, and other elements. Some basic ID questions in terms of the LMS follow:
• How is an LMS being used, and how can its users improve their use of this system to benefit the teaching and learning (individually and collectively)?
• How do technological changes in the LMS affect the required design of various digital learning objects and online-mediated learning experiences?
One of the main strengths of having an ID analyze such data is that he or she often knows the front end of the LMS fairly intimately and also has a sense of how the LMS system is used in a practical everyday way.
Engaging the Data
For me, I started with downloading the zipped data files from the data portal and collected these in a folder. I unzipped the files with the designated software. Then, I opened the files in MS Access (https://support.office.com/en-us/article/Access-2016-specifications-0cf3c66f-9cf2-4e32-9568-98c1025bb47c) because that enables more row data than Excel (which is only 1.05 million rows of data). Concurrent to the file exploration, it was helpful to have the formal data dictionary available. This dictionary is a document in which the makers of the LMS describe what data is available, the column headers and the related data, the discontinued or deprecated data, and other information related to “data governance”. (Various instantiations of the LMS employ some optional data fields.)
This particular data portal is only updated monthly. More dynamic near real-time versions of the data are available for an additional fee.
What were some analytical approaches?
Descriptive data: The simplest approaches involve descriptive data. For example, if there are a number of third party tools activated in the LMS, what are they, and what is their frequency of activated use? With counts, it is possible to set up cross-tab analyses to see if there are statistically significant occurrences of particular phenomena. For example, between traditional and nontraditional students, are there statistically significant behaviors in LMSes?
Time data: Another approach is to look at time data. For example, when were user accounts created? Another time-related approach is to study time-to-event (based on “survival analysis” statistical methods). For example, when was a quiz created vs. when it was activated for student test-taking?
Textual data: Another approach is to look at textual data—such as names of quizzes, names of discussion boards, discussion board comments, built-in email comments, and so on. These can be analyzed en masse using linguistic analysis tools—to find patterns in theme, sentiment, and other types of meaning-making. It is possible to do word searches (such as by name or topic or formula or emoticon), to zoom in directly on specific conversations and messages…and to see these results as a linked word tree, one step away from the original communicators.
Geospatial data: Geographical data may be analyzed to show where learners come from.
Of course, it is possible to filter data by time periods, by topics, and many other ways that data may be spliced and re-packaged for review. (At the time of this entry, the author had not found an easy way to delimit all contents to those of a particular course in a particular term. Back-end LMS data, as “flat files,” has some limits. The researcher here, too, has limits…which she is working to rectify.)
The above involves simple queries in an Access database, data exports, and then light analyses in tools like NVivo 11 Plus, LIWC2015, SPSS, and Excel. Resulting data may be expressed as various types of data visualizations: bar charts, linegraphs, treemaps, pie charts, geographical maps, and others. The analysis includes both manual and computational means, used in different sequences and in concert.
Other Possibilities
There are many other possibilities even with using just these flat files. A natural next step would be to place these in a SQL database, reconnect the relationships, and run specific queries, to drill down on information of interest. On-ground, the questions that we may want to answer may be more granular and less abstract or coarse-grained.
There is potential in social network analysis to see who is communicating with whom and to build networks by frequency of interactions. There is potential for machine learning applications (although these would take a fair amount of setup to extract clear and meaningful insights.)
University leadership is interested in seeing how this data may inform their decision-making, but they also want to make sure that such explorations can be sustainable in a tough funding environment. They want a clear “business case.” If such work is greenlighted, it will take some more time, effort, and resources to enable this as a natural part of the workflow.
An LMS Data Portal as a Mirror
So, in this first run, what were some highlights?
• Instructors reuse their email messaging a lot, with few small tweaks, between terms. There are efficiencies of scale.
• Many assignments are graded, and most are auto-graded. Some assignments require media recordings and online text entries, but these are rarer (even though they may be useful, particularly for the higher levels of learning.
• Half of assignments do not have a time allotment feature.
• Assignment names are mostly focused around the type, as in “discussion” or “quiz” or “participation” or “final.”
• Assignment names tend to rank high on analytics, clout (power), and positive tone, but low on “authenticity” or warmth.
• Virtually all assignments were updated after initial creation.
• Group sections are often set up in an undefined way with random assignment, followed by learner ability to self-enroll, and the least popular approach is by instructor or TA assignment to sections. In general, sections seem to be used in a pretty liberal way.
• Grades are used as part of the student motivation, and a majority of grades is viewable by students, with a small portion muted.
And much more. For more information about the initial report from the flat files, with specific numbers and percentages, please see “Wrangling Big Data in a Small Tech Ecosystem” (http://www.slideshare.net/ShalinHaiJew/wrangling-big-data-in-a-small-tech-ecosystem). This draft article describes the struggles wrangling the LMS data portal big data on a typical laptop, given an environment with tight resources.
Ultimately, LMS data portal data works as a mirror to reflect how an institution of higher education is using its LMS. If handled intelligently, this data may go beyond the reflective surface and offer depth.
About the Author
Dr. Shalin Hai-Jew is currently editing a book titled Methods for Analyzing and Exploiting Online Learning Data (https://www.igi-global.com/publish/call-for-papers/call-details/2515), and she welcomes any who might be interested to submit a chapter proposal.Browse for more posts in: Events & CollaborationsEducationKnowledge ManagementNorth America
There is a growing issue in the research community of authors submitting their articles to gold OA journals (and even hybrid OA/subscription-based journals), and then withdrawing their article after it has been accepted to the journal, effectively utilizing all of the resources of that journal, including the peer review, only to then refuse to publish at the end of the process.
NewsletterAuthor NewsOpen Access
Dr. Zeine has spoken about her research at several events. Most recently, she was a Guest Speaker at the SALIHIN Corporate Centre in Kuala Lumpur, Malaysia, providing insights and background related to the book. See below, where she answers some of our questions about the conception of this research book.
Medical, Healthcare, and Life SciencesBooks & E-Books
IGI Global and eContent Pro are holding a free webinar on Wednesday, June 12th at 10:30 AM EST via Microsoft Teams.
JournalsWebinar |